
What if the reporting tool you've been wishing for already exists in your Claude subscription?
For many teams, reporting still means exporting data, rebuilding spreadsheets, updating charts, and assembling the same presentation over and over again. And when the dashboards you really want sit behind another software tier or require technical help to build, the spreadsheet often wins by default.
But there may be another option.
In our new AI Apps & Agents Series course, Claude Artifacts, instructor Katie Robbert shows you how Claude can turn data you already have into a living, interactive dashboard, without writing code, buying another tool, or waiting on IT.
What Are Claude Artifacts?
A Claude Artifact goes beyond a one-time chat response or static report. It can become a reusable, interactive webpage that gives you a clearer way to explore and act on your data.
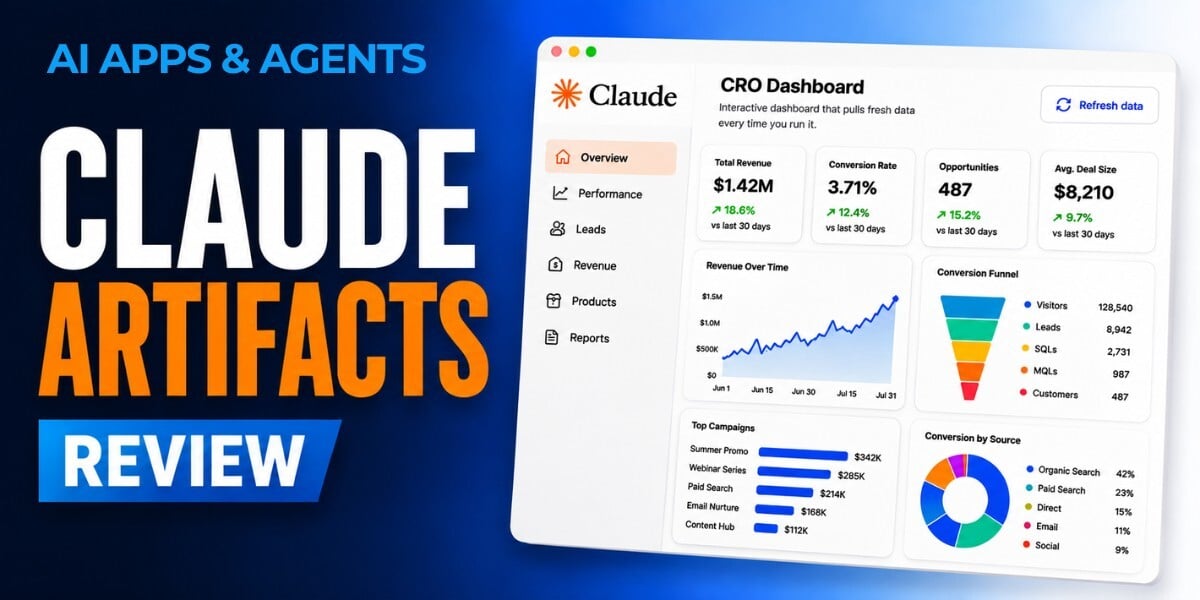
In the course, you'll see this in practice through a real-world CRO dashboard built from CRM data. Rather than manually assembling another spreadsheet, Claude does the heavy lifting of analyzing the data and turning it into an executive-ready view.
The finished artifact includes an executive summary, important KPIs, and action items with owners and dates, creating something a VP of Sales could actually use to make decisions and take action.
From CRM Export to Executive Dashboard
One of the biggest questions with AI tools is not simply what they can do, but what they're actually useful for.
This course gives you a concrete answer.
You'll watch a dashboard come together from a single prompt and a few CRM data files, moving from a blank workspace to an interactive report. Along the way, you'll see how Claude can help analyze the underlying data rather than simply make a prettier version of an existing spreadsheet.
You'll also learn how to recognize when your own reporting process may be ready for an artifact.
Recurring updates, multiple data sources, and reports you continually recreate by hand can all be signals that a spreadsheet is starting to outgrow its job.
Cowork or Code?
Building an artifact doesn't necessarily mean becoming a developer.
The course explains the practical differences between creating an artifact in Cowork and Code, including when each approach makes sense. For many non-developers, Cowork can provide what they need without requiring them to move into a coding environment.
You'll see both paths so you can make that decision based on the job you're trying to accomplish rather than the technology itself.
Where Artifacts Fit, and Where They Don't
Claude Artifacts aren't automatically a replacement for every dashboard or reporting platform.
You'll learn where an artifact can provide an advantage over a spreadsheet or static report and where tools such as Looker Studio or your CRM's built-in reporting may still make more sense.
The course also covers an important consideration before you build something your whole team will depend on: sharing and ownership.
You'll learn how artifacts can be shared, downloaded as PDFs, and kept up to date, along with the one-owner limitation you'll need to account for when handing an artifact off to a team.
What You'll Learn
- Explain what a Claude Artifact is and how it differs from a one-time chat response or static report.
- Identify recurring reports and data workflows that may be good candidates for an artifact.
- See how CRM data can become an interactive executive dashboard.
- Decide whether Cowork or Code is the right environment for your build.
- Understand the available options for keeping an artifact updated.
- Evaluate sharing, PDF download, and ownership considerations before rolling an artifact out to your team.
- Compare artifacts with spreadsheets, traditional dashboards, and built-in reporting tools.
Who Is This Course For?
Claude Artifacts is designed for marketers, small-business owners, data-curious professionals, and team leads who want better ways to work with recurring reports and scattered data.
It's especially useful if you're comfortable working in spreadsheets but tired of being responsible for manually rebuilding them, or if the dashboards you need require paying for another reporting tool or upgrading an existing platform.
No coding experience is required.
About the Instructor
Katie Robbert is the CEO of Trust Insights, co-host of In-Ear Insights, and community owner of Analytics for Marketers.
Her approach centers on process: if you can't clearly describe what you're doing as a process, neither you nor the AI has a reliable foundation for doing it consistently. In this course, she applies that perspective to a practical reporting workflow you can use to evaluate where Claude Artifacts might fit into your own work.
How to Watch
Claude Artifacts is available now to AI Mastery Membership members.
Watch Claude Artifacts in the AI Mastery Membership
In less than 20 minutes, you'll see how existing data can become a reusable, interactive dashboard and leave with a practical framework for deciding which of your own recurring reports may be ready to become an artifact.

Jeremy Zimmer
Jeremy Zimmer is the Director of Marketing for AI Academy by SmarterX.